Short Answer
Use the following information for questions:
Using data from 496 respondents in a past General Social Survey, an analysis of variance is done to compare the mean ages in five populations defined by the highest educational degree received (no high school degree, high school degree, junior college, bachelor degree, graduate degree). Some Minitab output is shown below. 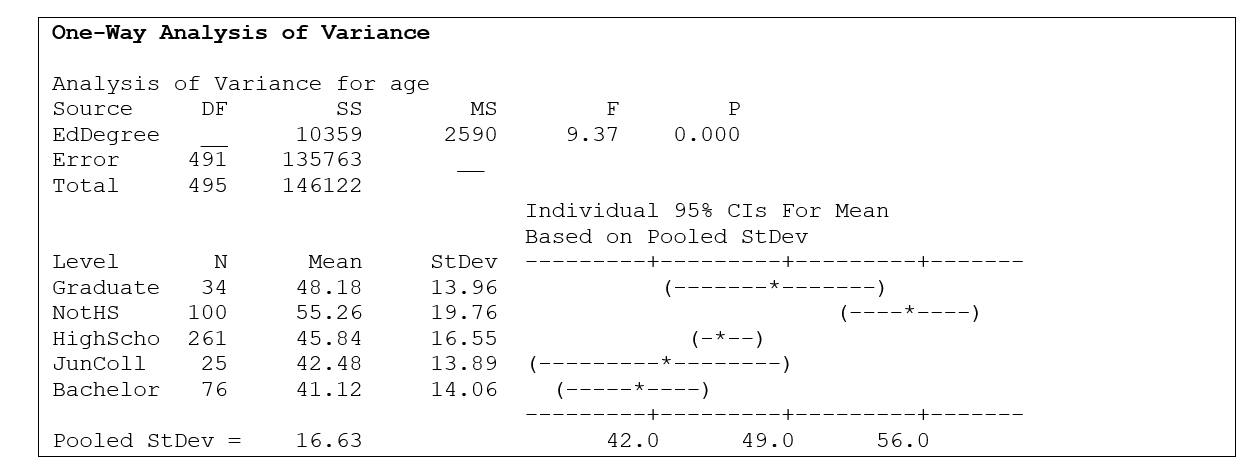
-What is the p-value?
Correct Answer:

Verified
Correct Answer:
Verified
Q4: Use the following information for questions:<br> A
Q5: Use the following information for questions:<br>
Q6: Use the following information for questions:<br>A researcher
Q7: At a certain college, the average difference
Q8: Use the following information for questions:<br>How old
Q10: Use the following information for questions:<br> A
Q11: Use the following information for questions:<br>Eighty-one customers
Q12: Use the following information for questions:<br>A supervisor
Q13: Ninety people with high cholesterol are randomly
Q14: Use the following information for questions:<br> A