menu-iconExamlexExamLexServices

Discover

Ask a Question
  1. All Topics
  2. Topic
    Statistics
  3. Study Set
    Mind on Statistics
  4. Exam
    Exam 3: Relationships Between Quantitative Variables
  5. Question
    A Scatterplot of X and Y Is Shown Below
Solved

A Scatterplot of X and Y Is Shown Below

Question 25

Question 25

Multiple Choice

A scatterplot of X and Y is shown below. Which value of the correlation coefficient, r, best describes the relationship? A scatterplot of X and Y is shown below. Which value of the correlation coefficient, r, best describes the relationship?   A)  r = 0.80 B)  r = -0.95 C)  r = -1.00 D)  r = -2
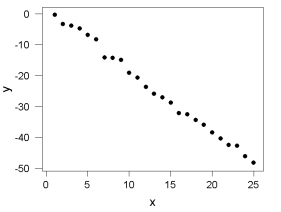

A) r = 0.80
B) r = -0.95
C) r = -1.00
D) r = -2

Correct Answer:

verifed

Verified

Unlock this answer now
Get Access to more Verified Answers free of charge

Related Questions

Q20: Use the following information for questions:<br> A

Q21: Use the following information for questions:<br> A

Q22: Which of the following is a deterministic

Q23: Use the following information for questions:<br>

Q24: Use the following information for questions:<br> Past

Q26: In an attempt to model the relationship

Q27: A survey of students found a negative

Q28: A regression line is a straight line

Q29: Correlation and regression are concerned with<br>A) the

Q30: A scatterplot is a<br>A) one-dimensional graph of

Examlex

ExamLex

About UsContact UsPerks CenterHomeschoolingTest Prep

Work With Us

Campus RepresentativeInfluencers

Links

FaqPricingChrome Extension

Download The App

Get App StoreGet Google Play

Policies

Privacy PolicyTerms of ServiceHonor CodeCommunity Guidelines

Scan To Download

qr-code

Copyright © (2025) ExamLex LLC.

Privacy PolicyTerms Of ServiceHonor CodeCommunity Guidelines