Multiple Choice
A scatterplot of the self-reported weights (y variable) and self-reported heights (x variable) for 176 college students follows. 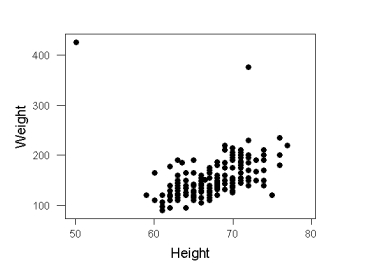 What is the main difficulty with using a regression line to analyze these data?
A) Presence of one or more outliers
B) Inappropriately combining groups
C) Curvilinear data
D) Response variable is not quantitative
Correct Answer:

Verified
Correct Answer:
Verified
Q61: A regression analysis done with Minitab
Q62: Use the following information for questions:<br>
Q63: A researcher reports that the correlation between
Q64: Use the following information for questions:<br> The
Q65: The correlation between father's heights and student's
Q67: Use the following information for questions:<br>
Q68: For which one of these relationships could
Q69: Use the following information for questions:<br>
Q70: Use the following information for questions:<br> Past
Q71: Two variables have a positive association when<br>A)