Multiple Choice
A scatterplot of the price of a book (y variable) versus the number of pages in the book (x variable) is shown for 15 books in a professors office. In addition, the symbol "o" shows that the book was a hardcover book, while the symbol "+" shows that the book was a softcover book. 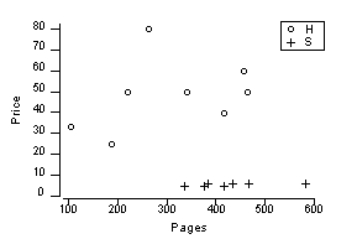 What is the main difficulty with using a regression line to analyze these data?
A) Presence of one or more outliers
B) Inappropriately combining groups
C) Curvilinear data
D) Response variable is not quantitative
Correct Answer:

Verified
Correct Answer:
Verified
Q72: Which one of the following is not
Q73: Use the following information for questions:<br> Consider
Q74: A professor found a negative correlation between
Q75: Which of the following correlation values indicates
Q76: A researcher would like to study the
Q78: Use the following information for questions:<br> Past
Q79: Which one of the following cannot be
Q80: A regression line can be used to
Q81: If the correlation coefficient between two quantitative
Q82: Describe the type of association shown in