Short Answer
The scatterplot below shows student heights (y axis) versus father's heights (x axis) for a sample of 173 college students. The symbol "+" represents a male student and the symbol "o" is represents a female student.
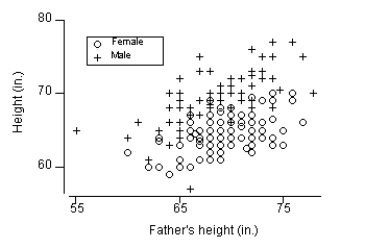 Based on the scatterplot, what is the problem with using a regression equation for all 173 students?
Correct Answer:

Verified
It appears that the men and wo...View Answer
Unlock this answer now
Get Access to more Verified Answers free of charge
Correct Answer:
Verified
View Answer
Unlock this answer now
Get Access to more Verified Answers free of charge
Q28: A regression line is a straight line
Q29: Correlation and regression are concerned with<br>A) the
Q30: A scatterplot is a<br>A) one-dimensional graph of
Q31: The following plot shows the association between
Q32: Use the following information for questions:<br>
Q34: Use the following information for questions:<br>
Q35: Use the following information for questions:<br>
Q36: Use the following information for questions:<br>
Q37: Describe the type of association shown in
Q38: Based on 1988 census data for the