Multiple Choice
Use the following information for questions:
The pie chart below shows the U.S. Energy Consumption by Energy Source for the year 2009. 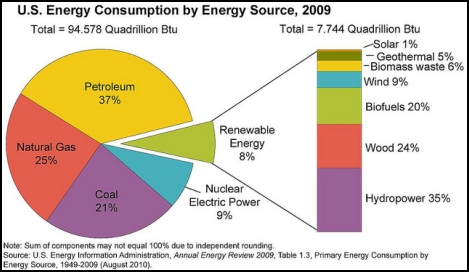
-The source with the highest consumption was
A) petroleum.
B) natural gas.
C) coal.
D) renewable energy.
Correct Answer:

Verified
Correct Answer:
Verified
Q32: Use the following information for questions:<br> According
Q33: Outliers cause complications in all statistical analyses.
Q34: Use the following information for questions:<br> The
Q35: Use the following information for questions:<br> Suppose
Q36: Use the following information for questions:<br> The
Q38: Which one of these statistics is unaffected
Q39: Since outliers cause complications in statistical analyses,
Q40: Which one of the following statistics would
Q41: Use the following information for questions:<br> Suppose
Q42: Use the following information for questions:<br>In a