Multiple Choice
Use the following information for questions:
The following histogram shows the distribution of the difference between the actual and "ideal" weights for 119 female college students. Ideal weights are responses to the question "What is your ideal weight"? The difference = actual -ideal. (Source: idealwtwomen dataset on the CD.) 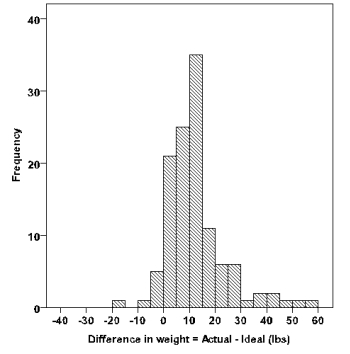
-What is the approximate shape of the distribution?
A) Nearly symmetric.
B) Skewed to the left.
C) Skewed to the right.
D) Bimodal (has more than one peak) .
Correct Answer:

Verified
Correct Answer:
Verified
Q78: Among 300 fatal car accidents, 135 were
Q79: The possible values for a standardized score
Q80: A five-number summary for a data set
Q81: Listed below is the number of Congressional
Q82: Use the following information for questions:<br>The following
Q84: Use the following information for questions:<br> The
Q85: Use the following information for questions:<br> The
Q86: For a large sample of blood pressure
Q87: What is a reasonable action if an
Q88: Which of the following provides the most