Multiple Choice
Which of the following figures shows an area that would be most susceptible to slope failure? 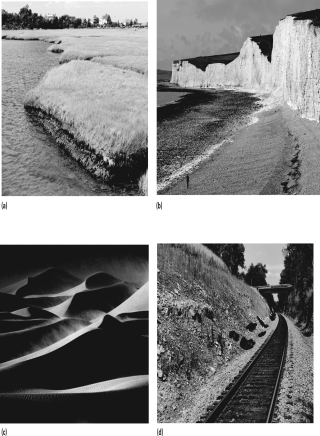
A) a
B) b
C) c
D) d
Correct Answer:

Verified
Correct Answer:
Verified
Related Questions
Q10: In the figure below,what would be the
Q16: A rock slide into a reservoir triggered
Q17: _ occurs when debris or snow mixes
Q18: Which of the following situations may lead
Q19: The principal difference between a debris flow
Q23: Moisture among sediment grains _.<br>A) always increases
Q26: Well-rounded sand has a smaller _ than
Q38: Which of the following situations is the
Q54: Which of the following situations would be
Q59: Which of the following types of mass