Multiple Choice
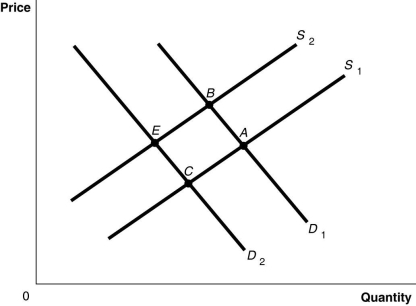
-Refer to Figure 3-8. The graph in this figure illustrates an initial competitive equilibrium in the market for apples at the intersection of D2 and S1 (point C) . Which of the following changes would cause the equilibrium to change to point B?
A) a positive change in the technology used to produce apples and decrease in the price of oranges, a substitute for apples
B) an increase in the wages of apple workers and an increase in the price of oranges, a substitute for apples
C) an increase in the number of apple producers and a decrease in the number of apple trees as a result of disease
D) a decrease in the wages of apple workers and an increase in the price of oranges, a substitute for apples
Correct Answer:

Verified
Correct Answer:
Verified
Q11: Suppose the cost of harvesting merino wool
Q12: Technological advances have resulted in lower prices
Q13: <img src="https://d2lvgg3v3hfg70.cloudfront.net/TB10505/.jpg" alt=" -Refer to Figure
Q14: If consumers believe the price of OLED
Q15: A decrease in the price of dashboard
Q17: Positive technological change in the production of
Q18: Select the phrase that correctly completes the
Q19: The athletic shoe industry is highly competitive.
Q20: Which of the following has occurred as
Q21: <img src="https://d2lvgg3v3hfg70.cloudfront.net/TB10505/.jpg" alt=" -Refer to Figure