Essay
A study was conducted to determine how people get jobs. Four hundred subjects were randomly selected and the results are listed below.
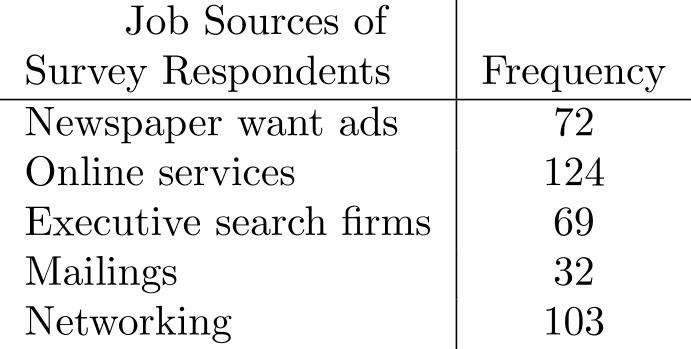 Construct a Pareto diagram in the form of a bar chart for the data. (Remember, in a Pareto diagram, the data is arranged in descending order.)
Correct Answer:

Verified
Correct Answer:
Verified
Q10: Table 1<br>A sample of 80 company employees
Q11: For the data below, construct an ogive.<br>
Q12: For a frequency distribution, we can never
Q13: A stem-and-leaf display contains no more information
Q14: A sample of 18 tries to connect
Q16: The Highway Patrol, using radar, checked the
Q17: If categories of a distribution differ in
Q18: In a study of the growth
Q19: A class interval can be defined as
Q20: In a cumulative "more than" distribution, the