Essay
For the data below, construct a frequency histogram and a frequency polygon.
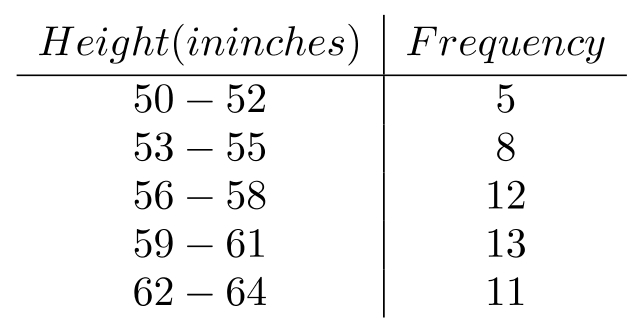
Correct Answer:

Verified
Correct Answer:
Verified
Related Questions
Q19: A class interval can be defined as
Q20: In a cumulative "more than" distribution, the
Q21: The single number that best represents a
Q22: A sample of 18 tries to connect
Q23: Table 1<br>A sample of 80 company employees
Q25: Frequency distributions are of two types: quantitative
Q26: In a software engineering class, the professor
Q27: To group data on the number
Q28: The heights (in inches) of 30
Q29: Which of the following would be a