Short Answer
Table 16.1
The table below shows annual profit figures (in thousands of dollars) for a company.
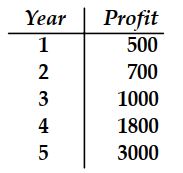
-Fit an exponential trend to the data in Table 16.1.
Correct Answer:

Verified
Correct Answer:
Verified
Related Questions
Q3: The symbol used to indicate the
Q4: In general, the smaller the standard error
Q5: The term which measures the dispersion
Q6: If we are testing the hypothesis
Q7: Using a 95% confidence level, construct
Q9: A multiple regression equation with three independent
Q10: If paired data plotted on log-log paper
Q11: In regression analysis, the quantity that
Q12: The normal equations are obtained from
Q13: The slope of the true regression