Short Answer
Table 18.2
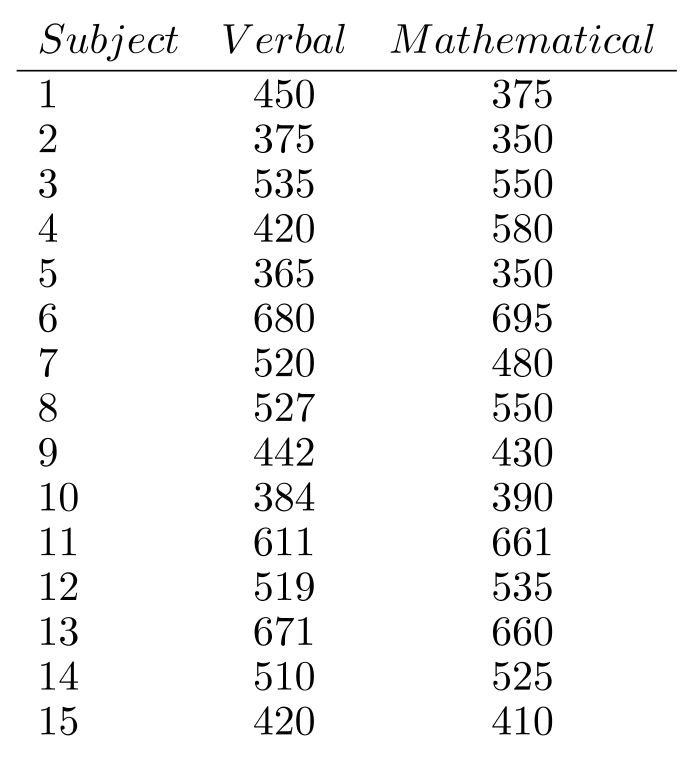
-Table 18.2 shows the scores made on the verbal and mathematical components of an S.A.T. by 15 high -school seniors who plan to go to a certain college. Use the table to calculate the Spearman Rank-Correlation Coefficient for the test scores.
Correct Answer:

Verified
Correct Answer:
Verified
Q5: The <span class="ql-formula" data-value="\mathrm{H}"><span class="katex"><span
Q6: A company that makes foot-long hot
Q7: The sign test is used with
Q8: Students were observed as they arrived
Q9: In the <span class="ql-formula" data-value="U"><span
Q11: Suppose we want to test whether or
Q12: Which of the following tests must be
Q13: In the <span class="ql-formula" data-value="U"><span
Q14: If there were an extremely large or
Q15: The Kruskal-Wallis test involves an application