Short Answer
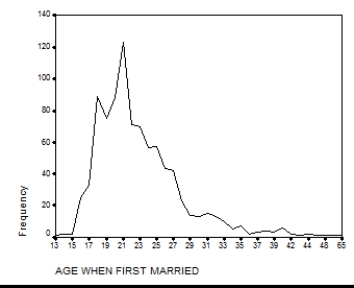
What other type of graph could be used to display the information in the chart below?
Correct Answer:

Verified
Correct Answer:
Verified
Related Questions
Q14: Imagine one of your colleagues is constructing
Q15: Fill in the empty cells in the
Q16: A table showing the frequency at or
Q17: Construct a cumulative frequency distribution using the
Q18: According to this table,what proportion of respondents
Q20: Would a bar chart or a histogram
Q21: Which of the following graphic devices is
Q22: Which graphic device would be most appropriate
Q23: Which graphic device is best suited for
Q24: Using the following information from the U.S.Census