Short Answer
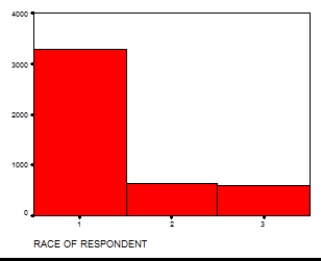
The following graph depicts the number of respondents by racial group,where 1 = white,2 = black,and 3 = other.Explain why this choice of graphic is or is not appropriate for these data.
Correct Answer:

Verified
A histogra...View Answer
Unlock this answer now
Get Access to more Verified Answers free of charge
Correct Answer:
Verified
A histogra...
View Answer
Unlock this answer now
Get Access to more Verified Answers free of charge
Related Questions
Q48: Fill in the empty cells in the
Q49: Fill in the empty cells in the
Q50: Construct either a bar chart or a
Q51: Fill in the empty cells in the
Q52: A survey of 3,055 respondents asked whether
Q54: A graph showing the differences in frequencies
Q55: Which of the following is not a
Q56: A relative frequency obtained by dividing the
Q57: Which graphic device would be most appropriate
Q58: Considering the information in the table below,what