Multiple Choice
The following diagram illustrates the Carbon Cycle. Each arrow represents the transfer of carbon from one component of the Earth system to another. For example, arrow 1 represents the transfer of carbon from the biosphere to the atmosphere. Match the lettered answers below to the number on the diagram.
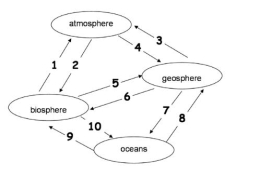
-Match the lettered answers to number 3 on the diagram.
A) Photosynthesis
B) Decay
C) Respiration
D) Volcanic eruption
E) Fossil fuel formation
Correct Answer:

Verified
Correct Answer:
Verified
Q20: What has happened to average global temperatures
Q21: The following diagram illustrates the Carbon Cycle.
Q22: Climate models predict global warming will increase
Q23: Annual plant growth cycles can be observed
Q24: All of the anthropogenic carbon dioxide remains
Q26: What is ozone?<br>A) O<br>B) O<sub>2</sub><br>C) O<sub>3</sub><br>D) O<sub>4</sub>
Q27: Which earth system component adds carbon to
Q28: Photolysis breaks down CFCs in the atmosphere.
Q29: Which earth system component removes carbon from
Q30: There is no ozone in the region