Multiple Choice
The following diagram illustrates the Carbon Cycle. Each arrow represents the transfer of carbon from one component of the Earth system to another. For example, arrow 1 represents the transfer of carbon from the biosphere to the atmosphere. Match the lettered answers below to the number on the diagram.
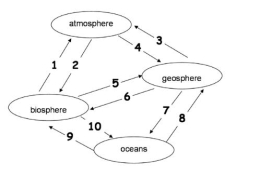
-Match the lettered answers to number 5 on the diagram.
A) Photosynthesis
B) Decay
C) Respiration
D) Volcanic eruption
E) Fossil fuel formation
Correct Answer:

Verified
Correct Answer:
Verified
Q8: Anthropogenic carbon dioxide is produced by vegetation.
Q9: The following diagram illustrates the Carbon Cycle.
Q10: Global precipitation has increased as temperatures increased
Q11: The following diagram illustrates the Carbon Cycle.
Q12: Where is carbon stored in the oceans?<br>A)
Q14: Global concentrations of carbon dioxide have increased
Q15: Suppose you have a choice of fuels
Q16: Atmospheric levels of CO<sub>2</sub> are higher than
Q17: What would happen to ozone levels if
Q18: Why has the rate of global warming