Multiple Choice
Which graph most accurately shows changes to biodiversity as a function of latitude? 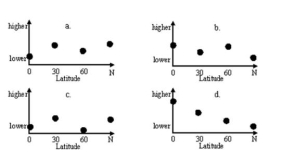
A) Graph a
B) Graph b
C) Graph c
D) Graph d
Correct Answer:

Verified
Correct Answer:
Verified
Related Questions
Q6: Biogeophysical cycles link the hydrosphere, biosphere, atmosphere,
Q7: When analyzing temperature anomaly data from a
Q8: Predict which of these biome groups would
Q9: What would happen to alpine glaciers in
Q10: Globally, where would you be most likely
Q12: You are analyzing a map location that
Q13: How does the amount of <sup>16</sup>O in
Q14: Predict what is presently happening to the
Q15: The earth was warmer 12,000 years ago
Q16: The Earth has been considerably warmer in