Multiple Choice
Answer this question that relate to the sea level change graph below.
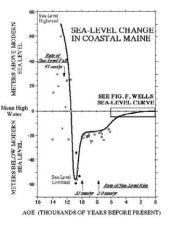
-What happened to cause the graph to rise from its position 11,000 years ago to where it is at present?
A) Excessive rains caused sea level to rise.
B) More evaporation began occurring that increased runoff.
C) Glaciers melted releasing large volumes of water.
Correct Answer:

Verified
Correct Answer:
Verified
Q16: Waves and currents are essentially the same
Q17: A dam is built upstream from where
Q18: <img src="https://d2lvgg3v3hfg70.cloudfront.net/TB10899/.jpg" alt=" -Which structures are
Q19: What would happen to tidal ranges if
Q20: <img src="https://d2lvgg3v3hfg70.cloudfront.net/TB10899/.jpg" alt=" -Suppose you have
Q22: Spring tides only occur in spring.
Q23: Most bathymetry measurements were made by sensors
Q24: <img src="https://d2lvgg3v3hfg70.cloudfront.net/TB10899/.jpg" alt=" -Which tide pattern
Q25: Salinity in the oceans does not vary.
Q26: Tides can occur once or twice a