Multiple Choice
The four schematic cross sections below show the potential groundwater resources for an area of hills and valleys. Assume the region is underlain by an open aquifer composed of sand and gravel and receives plentiful rainfall. Which diagram is the best representation of the relationship between topography and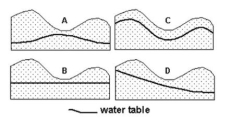 water table?
A) Diagram A
B) Diagram B
C) Diagram C
D) Diagram D
Correct Answer:

Verified
Correct Answer:
Verified
Q8: An aquifer is the same as an
Q9: Read the following passage taken from http://www.nwrc.usgs.gov/about/5-year-plan.htm.<br>Think
Q10: If rock A has greater porosity than
Q11: Read the following passage taken from http://www.nwrc.usgs.gov/about/5-year-plan.htm.<br>Think
Q12: Specific retention increases with decreasing grain size.
Q14: Read the following passage taken from http://www.nwrc.usgs.gov/about/5-year-plan.htm.<br>Think
Q15: Groundwater is made up of a network
Q16: Wetlands must be covered with water all
Q17: If rock A has greater permeability than
Q18: The cross section below simplifies the groundwater