Multiple Choice
Use this stream-related diagram to answer the following questions.
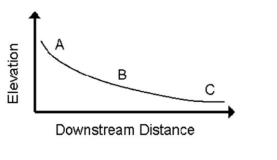
-Where is the highest average stream velocity?
A) Point A
B) Point B
C) Point C
Correct Answer:

Verified
Correct Answer:
Verified
Q31: Where do stream channels experience the most
Q32: Globally, what is the largest source of
Q33: Use the following idealized stream channel to
Q34: The following diagram illustrates the Hydrologic Cycle.
Q35: Which statement about the stream cross-sectional velocity
Q37: <img src="https://d2lvgg3v3hfg70.cloudfront.net/TB10899/.jpg" alt=" -Why did the
Q38: Use the Hydrologic Cycle diagram to answer
Q39: The following diagram illustrates the Hydrologic Cycle.
Q40: Which of the following is not a
Q41: <img src="https://d2lvgg3v3hfg70.cloudfront.net/TB10899/.jpg" alt=" -What happens to