Multiple Choice
What time of year is represented by the global insolation data shown in the diagram below? 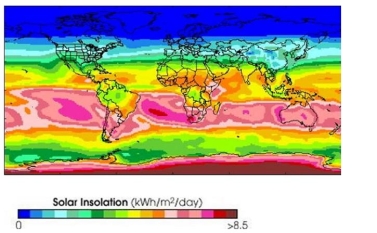
A) January
B) July
C) No way to tell
Correct Answer:

Verified
Correct Answer:
Verified
Related Questions
Q9: Temperatures on Earth would be lower if
Q10: If Earth was smaller it would have
Q11: Analyze the map and select the proper
Q12: Which type of planet is most likely
Q13: Which statement comparing terrestrial and jovian planets
Q15: What type of cooling mechanism relies on
Q16: Analyze the map and select the proper
Q17: Life on Earth would most likely be
Q18: Which of these diagrams best illustrates the
Q19: Predict what happens to the brightness of