Multiple Choice
Figure 43.3 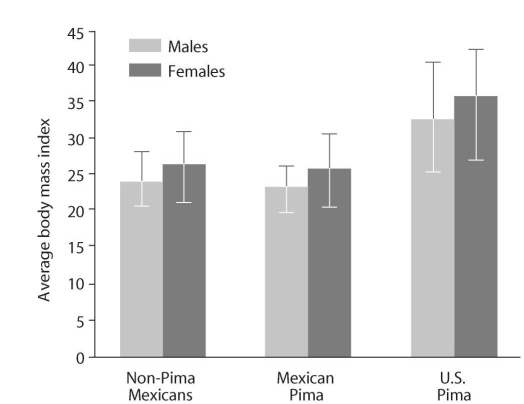
-Based on the graph in the Figure 43.3,what can you infer about the incidence of type II diabetes mellitus?
A) Obesity is a risk factor for development of type II diabetes mellitus.
B) If you maintain a normal body weight (BMI < 25) ,you will not get type II diabetes mellitus.
C) The incidence of type II diabetes mellitus has increased in the past 10 years.
D) People who develop type II diabetes mellitus are typically diagnosed in childhood or adolescence.
Correct Answer:

Verified
Correct Answer:
Verified
Q10: Refer to the following nutrition label for
Q21: Protein digestion begins where?<br>A)in the mouth<br>B)in the
Q22: If there is a strong genetic link
Q24: Vitamin D is indirectly responsible for calcium
Q25: What can the mouthparts of an animal
Q28: Why did scientists originally hypothesize that proteolytic
Q29: A major enzyme involved in protein digestion
Q30: The parietal cells that line the stomach
Q31: Aquaporins have been identified in the epithelium
Q34: Amino acids,dipeptides,and sugars are transported from intestinal