Multiple Choice
Figure 53.7 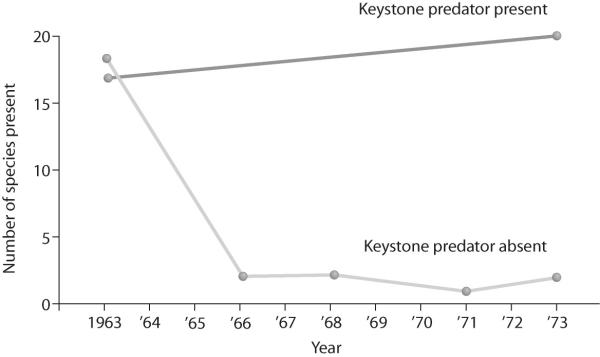
-What does the graph in the figure above tell you about the definition of a keystone species?
A) A keystone species has little interaction with other species in an environment.
B) A keystone species removed from a community could have drastic effects.
C) A keystone species can be any species.
D) A keystone species added to a community can make it more robust.
Correct Answer:

Verified
Correct Answer:
Verified
Q5: Which are the only two interaction types
Q17: Some birds follow moving swarms of army
Q20: Figure 53.11 <img src="https://d2lvgg3v3hfg70.cloudfront.net/TB3733/.jpg" alt="Figure 53.11
Q23: Bouchard and Brooks (2004)studied the effect of
Q24: During a one year study,researchers found no
Q25: The competitive exclusion principle states that<br>A)it is
Q28: What is the main difference between a
Q32: <img src="https://d2lvgg3v3hfg70.cloudfront.net/TB6548/.jpg" alt=" Figure 52.1 -According
Q39: While traveling in Texas,you stumble across a
Q50: Which one of the following animals would