Multiple Choice
Figure 54.3 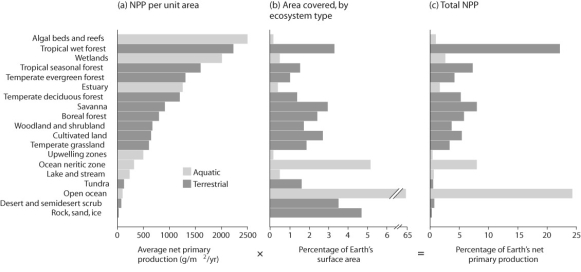
-In the figure above,how is net primary productivity represented?
A) organized by biome
B) organized by geography
C) organized by region
D) randomly organized
Correct Answer:

Verified
Correct Answer:
Verified
Q15: Which of the following could be a
Q20: Considering the global carbon cycle, where are
Q23: Use the following information when answering the
Q23: What do researchers typically focus on when
Q24: <img src="https://d2lvgg3v3hfg70.cloudfront.net/TB6548/.jpg" alt=" Figure 53.3 -Which
Q29: Figure 54.5 <img src="https://d2lvgg3v3hfg70.cloudfront.net/TB3733/.jpg" alt="Figure 54.5
Q35: Figure 54.10 <img src="https://d2lvgg3v3hfg70.cloudfront.net/TB3733/.jpg" alt="Figure 54.10
Q36: Figure 54.4 <img src="https://d2lvgg3v3hfg70.cloudfront.net/TB3733/.jpg" alt="Figure 54.4
Q37: Figure 54.3 <img src="https://d2lvgg3v3hfg70.cloudfront.net/TB3733/.jpg" alt="Figure 54.3
Q38: Which of the following most often controls