Multiple Choice
Figure 54.6 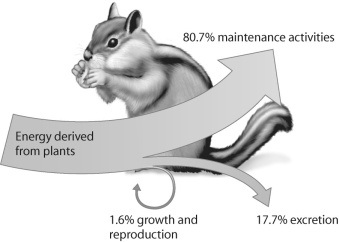
-In the figure above,which number represents secondary production?
A) 1) 6%
B) 17.7%
C) 80.7%
D) none of the above
Correct Answer:

Verified
Correct Answer:
Verified
Q9: Considering the current scientific literature on global
Q18: Figure 54.9 <img src="https://d2lvgg3v3hfg70.cloudfront.net/TB3733/.jpg" alt="Figure 54.9
Q21: Figure 54.10 <img src="https://d2lvgg3v3hfg70.cloudfront.net/TB3733/.jpg" alt="Figure 54.10
Q25: Figure 54.8 <img src="https://d2lvgg3v3hfg70.cloudfront.net/TB3733/.jpg" alt="Figure 54.8
Q26: When primary producers expend energy to build
Q26: Once heat is transferred to the soil,where
Q37: Figure 54.5 <img src="https://d2lvgg3v3hfg70.cloudfront.net/TB3734/.jpg" alt="Figure 54.5
Q38: At the Hubbard Brook Experimental Forest in
Q38: Which of the following most often controls
Q40: Figure 54.6 <img src="https://d2lvgg3v3hfg70.cloudfront.net/TB3734/.jpg" alt="Figure 54.6