Multiple Choice
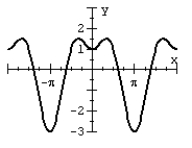
The figure below shows the graph of
Between -2 and 2 . The maximum and minimum values of the curve occur at the turning points and are found in the solutions of the equation
Solve for the coordinates of the turning points of the curve between
A) 
B) 
C) 
D) 
Correct Answer:

Verified
Correct Answer:
Verified
Q125: Use a half-angle identity to find the
Q126: Evaluate <br> <img src="https://d2lvgg3v3hfg70.cloudfront.net/TB10663/.jpg" alt="Evaluate
Q127: Graph <img src="https://d2lvgg3v3hfg70.cloudfront.net/TB10663/.jpg" alt="Graph by
Q128: The number of hours of daylight in
Q129: Use a reciprocal identity to find cos
Q131: Use a calculator to evaluate the expression.
Q132: Solve the given trigonometric equation exactly over
Q133: Find the exact value of tan(210°).
Q134: Use a half-angle identity to find csc<br>
Q135: Solve the given trigonometric equation exactly for