menu-iconExamlexExamLexServices

Discover

Ask a Question
  1. All Topics
  2. Topic
    Mathematics
  3. Study Set
    Precalculus
  4. Exam
    Exam 12: Review: Equations and Inequalities
  5. Question
    Draw a Scatter Plot for This Data.x
Solved

Draw a Scatter Plot for This Data.x

Question 183

Question 183

Short Answer

Draw a scatter plot for this data.x

Correct Answer:

verifed

Verified

Unlock this answer now
Get Access to more Verified Answers free of charge

Related Questions

Q178: Transform the equation<br> <img src="https://d2lvgg3v3hfg70.cloudfront.net/TB10663/.jpg" alt="Transform the

Q179: Write an equation that describes the variation.<br>y

Q180: Rewrite in interval notation.<br>X > -18<br>A) <img

Q181: Use algebraic tests to determine whether the

Q182: Find the slope of the line that

Q184: The perimeter, P, of a rectangle is

Q185: Solve the polynomial inequality and express the

Q186: Write an equation that describes the

Q187: Solve using the square root method.<br>(x -

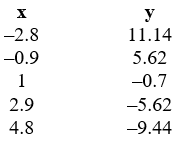
Q188: Draw a scatter plot for this data.x<br>

Examlex

ExamLex

About UsContact UsPerks CenterHomeschoolingTest Prep

Work With Us

Campus RepresentativeInfluencers

Links

FaqPricingChrome Extension

Download The App

Get App StoreGet Google Play

Policies

Privacy PolicyTerms of ServiceHonor CodeCommunity Guidelines

Scan To Download

qr-code

Copyright © (2025) ExamLex LLC.

Privacy PolicyTerms Of ServiceHonor CodeCommunity Guidelines