menu-iconExamlexExamLexServices

Discover

Ask a Question
  1. All Topics
  2. Topic
    Mathematics
  3. Study Set
    Precalculus
  4. Exam
    Exam 12: Review: Equations and Inequalities
  5. Question
    Draw a Scatter Plot for This Data.x
Solved

Draw a Scatter Plot for This Data.x

Question 51

Question 51

Short Answer

Draw a scatter plot for this data.x

Correct Answer:

verifed

Verified

Unlock this answer now
Get Access to more Verified Answers free of charge

Related Questions

Q46: In 2004 Americans used approximately 392 billion

Q47: Solve x<sup>3</sup> + x<sup>2</sup> - 49x -

Q48: Find the solution set of the equation

Q49: The area of a rectangle is 135

Q50: Introduce a u - substitution that transforms

Q52: Solve the polynomial inequality and express the

Q53: Solve the polynomial inequality and express the

Q54: Solve the polynomial inequality and express the

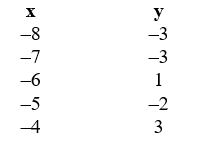
Q55: Plot the graph of the given equation.<br>

Q56: Plot the graph of the given equation.<br>x

Examlex

ExamLex

About UsContact UsPerks CenterHomeschoolingTest Prep

Work With Us

Campus RepresentativeInfluencers

Links

FaqPricingChrome Extension

Download The App

Get App StoreGet Google Play

Policies

Privacy PolicyTerms of ServiceHonor CodeCommunity Guidelines

Scan To Download

qr-code

Copyright © (2025) ExamLex LLC.

Privacy PolicyTerms Of ServiceHonor CodeCommunity Guidelines