Multiple Choice
Plot the graph of the given equation.
X= y2 -1
A) 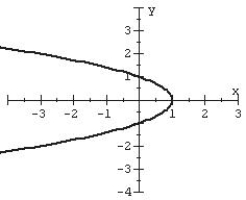
B) 
C) 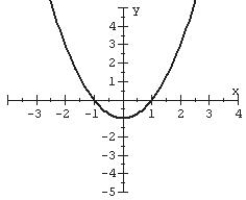
D) 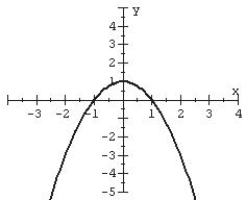
Correct Answer:

Verified
Correct Answer:
Verified
Related Questions
Q129: Solve and express solution set in interval
Q130: For the graph, determine the slope. <img
Q131: Use linear regression to determine the line
Q132: Introduce a u - substitution that transforms
Q133: Draw a scatter plot for this data.x<br>
Q135: Which of the following applies to the
Q136: Write an equation that describes the variation.
Q137: Write the equation of the line given
Q138: Find the x- and y-intercepts of the
Q139: Solve the radical equation. <img src="https://d2lvgg3v3hfg70.cloudfront.net/TB10663/.jpg" alt="Solve