Essay
The following ANOVA table corresponds to an experiment on pizza preference (0-10) based on the topping (plain, sausage, pepperoni, or everything). The mean preference by groups are as follows:
Plain: 8.5
Sausage: 6.8
Pepperoni: 6.5
Everything: 2.7
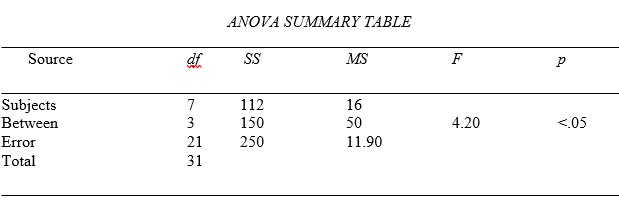 Fill in the table for a within-subjects design with a total of 8 subjects, draw the graph representing the data, calculate eta-squared and Tukey's HSD, and draw conclusions based on the ANOVA table and the means provided.
Correct Answer:

Verified
Eta-squared = 29%
HSD.05 = 4.82
HSD.01 = 6.07
...View Answer
Unlock this answer now
Get Access to more Verified Answers free of charge
Correct Answer:
Verified
HSD.05 = 4.82
HSD.01 = 6.07
...
View Answer
Unlock this answer now
Get Access to more Verified Answers free of charge
Q6: In a repeated measures ANOVA, the formula
Q7: Calculate Tukey's HSD (honestly significant difference) and
Q8: In a repeated measures ANOVA, the formula
Q9: In a repeated measures ANOVA, the final
Q10: If a researcher reported an F-ratio with
Q11: In a repeated measures ANOVA, to calculate
Q12: In a repeated measures ANOVA, the formula
Q13: If a repeated measures ANOVA produced MS<sub>between</sub>
Q14: In a repeated measures ANOVA, the formula
Q16: In a repeated measures ANOVA, the formula