Essay
The following table shows the number of computers (in millions) sold in the years 1996-2010: 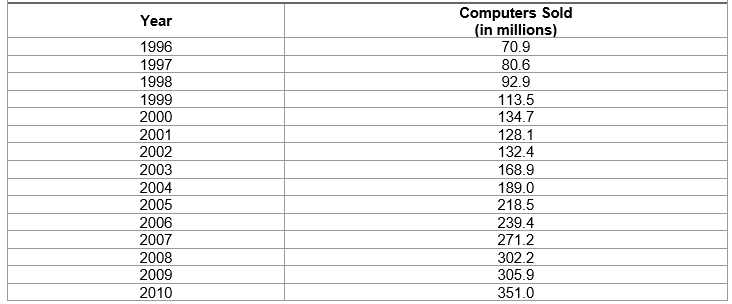 Make an x-y graph of the sales versus the year.
Correct Answer:

Verified
Correct Answer:
Verified
Related Questions
Q58: Consider the below set of lengths
Q59: If a die is rolled seven times,
Q60: Find the correlation coefficient and the least
Q61: If we throw two dice, what is
Q62: A random sample of 500 parts found
Q63: A certain circuit has a resistance
Q64: Define the following type of data as
Q66: A random sample of 60 new
Q67: The amount of caffeine in a
Q68: In a cell phone transmission tower there