Multiple Choice
Solve the problem.
-The information in the chart below gives the salary of a person for the stated years. Model the data with a linear equation using the points and . Then use this equation to predict the salary for the year 2002 .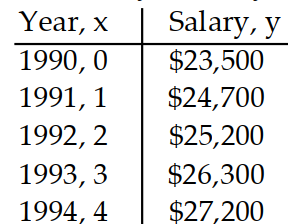
A)
B)
C)
D)
Correct Answer:

Verified
Correct Answer:
Verified
Q148: Find the x-intercepts and y-intercepts of
Q149: Use technology to compute <span
Q150: Use a graphing calculator to approximate
Q151: Solve the problem.<br>-The population <span
Q152: Solve the problem.<br>-<img src="https://d2lvgg3v3hfg70.cloudfront.net/TB10479/.jpg" alt=" Solve
Q154: Find the slope and the y-intercept
Q155: Decide whether the pair of lines
Q156: Solve the problem.<br>-The height <span
Q157: Use a graphing calculator to find
Q158: Solve the problem using your calculator.<br>-The