Multiple Choice
Use the graph to solve the problem.
-The population (in thousands) of one city is approximated by
The graph of this function is shown below. In this graph, represents 1970. Use the graph to estimate the population of the city in 1986.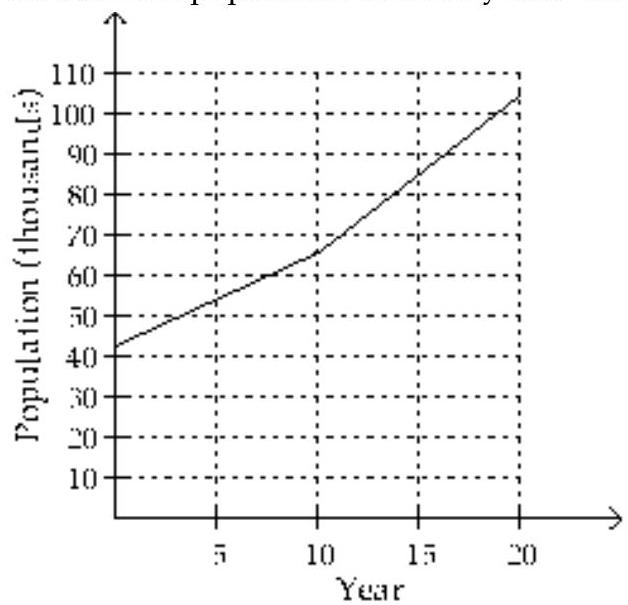
A) About 96,400
B) About 78,400
C) About 89,400
D) About 82,400
Correct Answer:

Verified
Correct Answer:
Verified
Q211: Give the equation of the vertical
Q212: Graph the piecewise linear function.<br>- <span
Q213: Use the graph to solve the
Q214: Graph the function.<br>- <span class="ql-formula" data-value="y=[x-1]"><span
Q215: Use the vertical line test to determine
Q217: Find the rule of a quadratic
Q218: State the domain of the given
Q219: Graph the function.<br>- <span class="ql-formula" data-value="f(x)=x^{3}-3"><span
Q220: Solve the problem.<br>-In the following formula,
Q221: Graph the function.<br>- <span class="ql-formula" data-value="f(x)=(x-6)^{2}"><span