Multiple Choice
Use the graph to solve the problem.
-In one city, the temperature in Fahrenheit on a typical summer day can be approximated by the following function:
Here, represents the number of hours since 6 a.m. The graph of this function is shown below. At what time is the temperature the highest?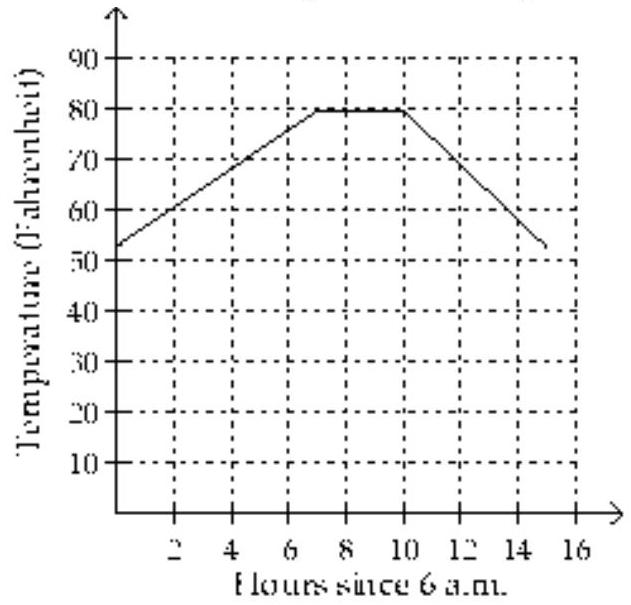
A) Between 1 p.m. and 2 p.m.
B) Between 1 p.m. and 4 p.m.
C) Between 7 a.m. and 10 a.m.
D) Between 2 p.m. and 5 p.m.
Correct Answer:

Verified
Correct Answer:
Verified
Q149: Solve the problem.<br>-Suppose that the change
Q150: State the domain of the given
Q151: Graph the polynomial function.<br>- <span class="ql-formula"
Q152: Graph the linear function.<br>- <span class="ql-formula"
Q153: Solve the problem.<br>-The graph of a function
Q155: Solve the problem.<br>-Assume that the sales
Q156: Use the graph to solve the
Q157: Find the appropriate linear cost or
Q158: Find a quadratic function that models
Q159: Graph the piecewise linear function.<br>- <span