Multiple Choice
Use the graph to solve the problem.
-In one city, the temperature in Fahrenheit on a typical summer day can be approximated by the following function:
Here, represents the number of hours since 6 a.m. The graph of this function is shown below. At what time does it start to get cooler?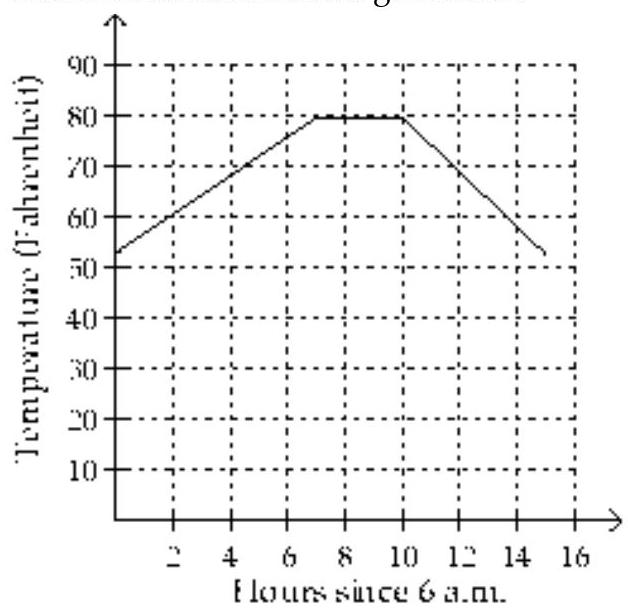
A) At 10 a.m.
B) At 4 p.m.
C) At 1 p.m.
D) At 3 p.m.
Correct Answer:

Verified
Correct Answer:
Verified
Q124: Use a graphing calculator to construct
Q125: Graph the rational function.<br>- <span class="ql-formula"
Q126: Solve the problem.<br>-At a manufacturing plant,
Q127: Graph.<br>- <span class="ql-formula" data-value="f(x)=5(x+2)^{2}+3"><span class="katex"><span class="katex-mathml"><math
Q128: Solve the problem.<br>-John owns a hotdog
Q130: Solve the problem.<br>-A house was purchased
Q131: Solve the problem.<br>-The graph of a function
Q132: Evaluate the function.<br>-Find <span class="ql-formula"
Q133: State whether the parabola opens upward
Q134: Find the appropriate linear cost or