Multiple Choice
Find a quadratic function that models the data.
-The table shows the number of new AIDS cases among women in the U.S. in six consecutive years. Data are in thousands rounded to the nearest hundred.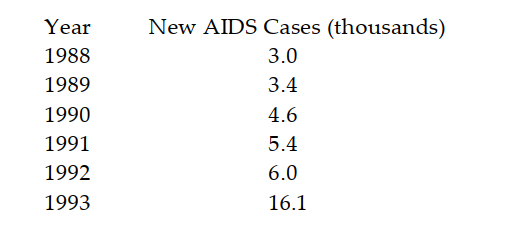
Let correspond to 1988 and let be the number of new AIDS cases (in thousands) among women in the U.S. in year . Using the point as the vertex and as the other point, determine a quadratic function that models the data.
A)
B)
C)
D)
Correct Answer:

Verified
Correct Answer:
Verified
Q42: Solve the problem.<br>-A salesperson gets a
Q43: Graph the function.<br>- <span class="ql-formula" data-value="f(x)=|3
Q44: Give the equation of the horizontal
Q45: Graph the parabola.<br>- <span class="ql-formula" data-value="f(x)=2
Q46: Evaluate the function.<br>-Given that <span
Q48: For the given function, find
Q49: Evaluate the function.<br>-Given that <span
Q50: Give the equation of the vertical
Q51: Give the equation of the vertical
Q52: Graph the linear function.<br>- <span class="ql-formula"