Multiple Choice
Find a quadratic function that models the data.
-The table shows the population of a city in selected years. Data are in thousands rounded to the nearest hundred.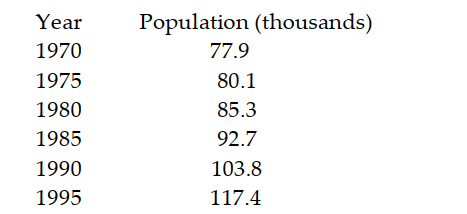
Let correspond to 1970 and let be the population of the city (in thousands) in year . Using the point as the vertex and and the data from 1995, determine a quadratic function that models the data.
A)
B)
C)
D)
Correct Answer:

Verified
Correct Answer:
Verified
Q8: Graph the function.<br>- <span class="ql-formula" data-value="f(x)=|x|-1"><span
Q9: State the domain of the given
Q10: Solve the problem.<br>-The demand for a
Q11: Solve the problem.<br>-Suppose a car rental
Q12: Graph the piecewise linear function.<br>- <span
Q14: Find the rule of a quadratic
Q15: Solve the problem.<br>-The graph of a function
Q16: Solve the problem.<br>-The graph of a
Q17: Graph the linear function.<br>- <span class="ql-formula"
Q18: Use the vertical line test to determine