Multiple Choice
Solve the problem.
-The given contingency table gives the number (in thousands) of U.S. households classified by educational attainment (high school graduate or less denoted with , some college with no degree denoted B, an associate's degree denoted with , and a bachelor's degree or higher denoted with D) and household income ( $ 0 - $34,999 denoted with E, $35,000-$49,999 denoted with F, $50,000-$74,999 denoted G, and $ 75,000 and over denoted H) .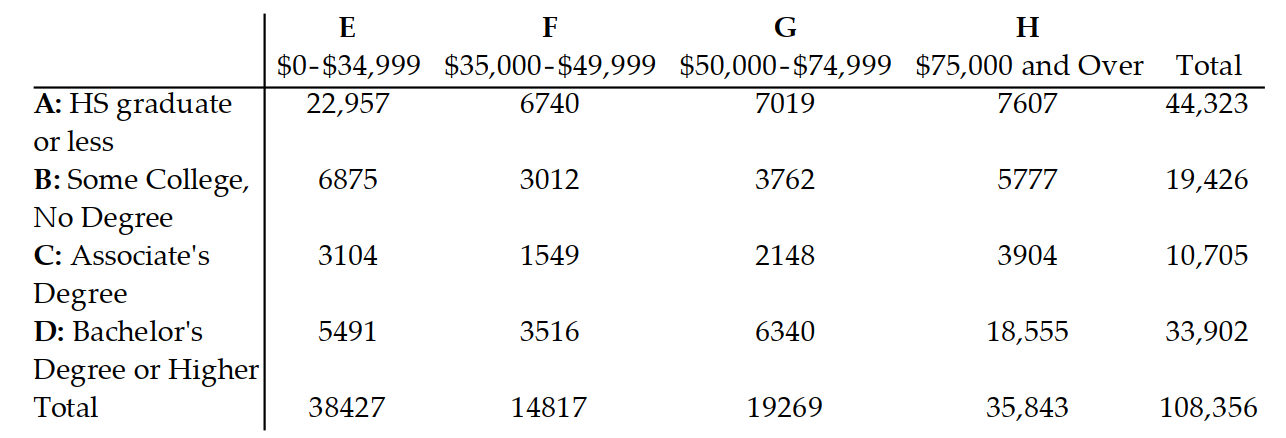
Find the number of households in the given set.
A) 44,607
B) 22148
C) 35,843
D) 22,459
Correct Answer:

Verified
Correct Answer:
Verified
Q42: Find the odds in favor of the
Q43: Shade the Venn diagram to represent
Q44: Solve the problem using Bayes' Theorem.
Q45: Can <span class="ql-formula" data-value="\mathrm{P}(\mathrm{A} \mid
Q46: Let <span class="ql-formula" data-value="U=\{q, r,
Q48: Find the odds in favor of the
Q49: Provide an appropriate response.<br>-To find
Q50: Shade the Venn diagram to represent
Q51: A die is rolled twice. Write
Q52: Write the sample space for the