Multiple Choice
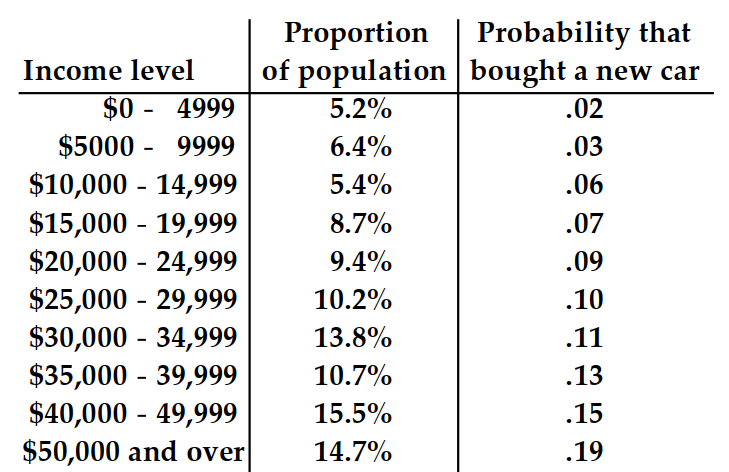
The table shows, for some particular year, a listing of several income levels and, for each level, the proportion of the population in the level and the probability that a person in that level bought a new car during the year. Given that one of the people who bought a new car during that year is randomly selected, find the probability that that person was in the indicated income category. Round your answer to the nearest hundredth.
- -
A) .05
B) .01
C) .03
D) .02
Correct Answer:

Verified
Correct Answer:
Verified
Q33: Decide whether the two events listed
Q34: Find the odds in favor of the
Q35: Let <span class="ql-formula" data-value="\mathrm{U}"><span class="katex"><span
Q36: Use a Venn Diagram and the
Q37: Solve the problem, rounding the answer
Q39: Write the word or phrase that
Q40: Use a Venn Diagram and the
Q41: Solve the problem. Express the answer
Q42: Find the odds in favor of the
Q43: Shade the Venn diagram to represent