Multiple Choice
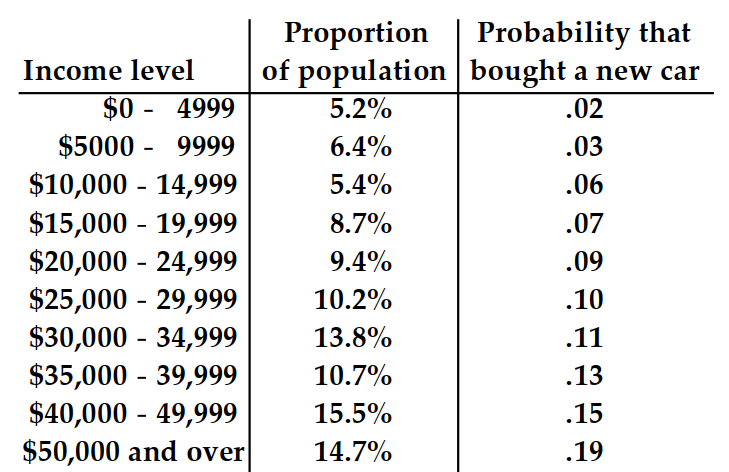
The table shows, for some particular year, a listing of several income levels and, for each level, the proportion of the population in the level and the probability that a person in that level bought a new car during the year. Given that one of the people who bought a new car during that year is randomly selected, find the probability that that person was in the indicated income category. Round your answer to the nearest hundredth.
- -
A) .05
B) .03
C) .06
D) .02
Correct Answer:

Verified
Correct Answer:
Verified
Q134: Find the odds in favor of the
Q135: An experiment consists of tossing a fair
Q136: Use a Venn diagram to decide if
Q137: Use the given table to find
Q138: Solve the problem.<br>-Below is a table
Q140: Assume that two marbles are drawn
Q141: Tell whether the statement is true
Q142: Use a Venn Diagram and the
Q143: Suppose P(C) = .048, P(M �ꓵ C)
Q144: Use a Venn Diagram and the