Multiple Choice
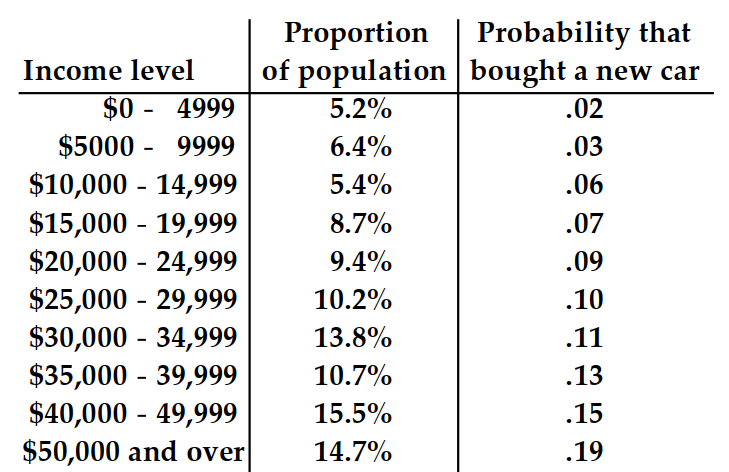
The table shows, for some particular year, a listing of several income levels and, for each level, the proportion of the population in the level and the probability that a person in that level bought a new car during the year. Given that one of the people who bought a new car during that year is randomly selected, find the probability that that person was in the indicated income category. Round your answer to the nearest hundredth.
-
A) .14
B) .13
C) .07
D) .09
Correct Answer:

Verified
Correct Answer:
Verified
Q177: Find the probability of the given
Q178: The table shows, for some particular
Q179: Find the number of subsets of the
Q180: Use a Venn diagram to decide
Q181: Write the sample space for the
Q183: Find the number of subsets of
Q184: Suppose P(C) = .048, P(M ꓵ
Q185: Find the probability.<br>-A basketball player hits
Q186: Solve the problem. Express the answer
Q187: Use a Venn Diagram and the