Multiple Choice
Solve the problem.
-The stem and leaf plot depicts the scores earned on individual driver tests in the month of July.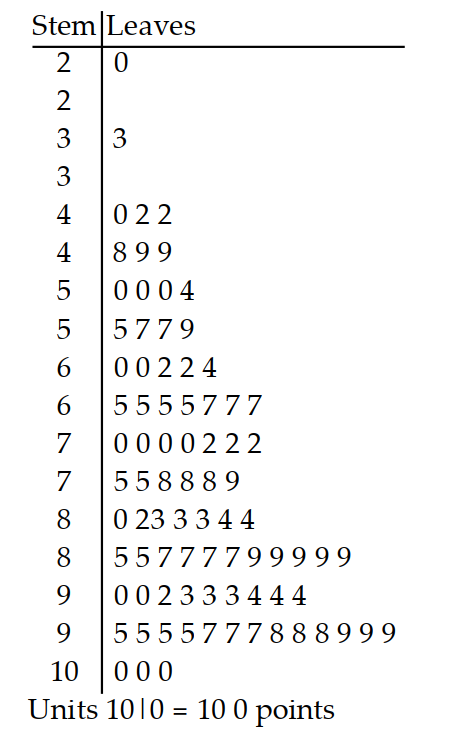
How many people scored fewer than 50 points?
A) 10
B) 8
C) 76
D) 11
Correct Answer:

Verified
Correct Answer:
Verified
Related Questions
Q70: Find the mean for the frequency distribution.
Q71: Construct a boxplot.<br>-The weights (in ounces)
Q72: Find the mean for the frequency distribution.
Q73: At one high school, students can
Q74: Solve the problem.<br>-Find the percent of
Q76: Describe the shape of the given histogram.<br>-<img
Q77: Find the median.<br>-The weights (in ounces)
Q78: At one high school, students can
Q79: Find the range for the set
Q80: Construct a frequency polygon.<br>-<img src="https://d2lvgg3v3hfg70.cloudfront.net/TB10479/.jpg" alt="Construct a