Multiple Choice
Solve the problem.
-The histogram shows the percentage of residential properties in negative equity or near negative equity for several states.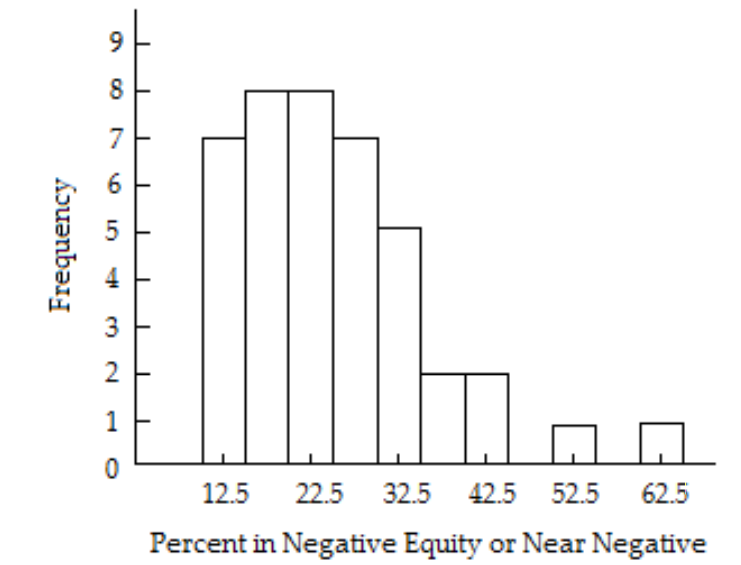
Describe the shape of the distribution.
A) Left skewed
B) Right skewed
C) Normal
D) Uniform
Correct Answer:

Verified
Correct Answer:
Verified
Related Questions
Q145: Solve the problem.<br>-The stem and leaf plot
Q146: Find the area under the normal
Q147: Solve the problem.<br>-The histogram shows the
Q148: Find the standard deviation. Round to
Q149: Prepare a frequency distribution for the
Q151: A company installs 5000 light bulbs, each
Q152: Find a <span class="ql-formula" data-value="z"><span
Q153: Find the mean for the list
Q154: Find the standard deviation. Round to
Q155: A company installs 5000 light bulbs, each