Multiple Choice
Find the standard deviation of the data summarized in the given frequency table.
-The test scores of 40 students are summarized in the frequency table below. Find the standard deviation.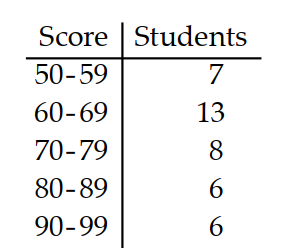
A) 14
B) 12.6
C) 13.3
D) 12
Correct Answer:

Verified
Correct Answer:
Verified
Related Questions
Q89: At one high school, students can
Q90: Find the mean<br>-Six college buddies bought
Q91: Assume the distribution is normal. Use
Q92: At one high school, students can
Q93: Obtain the five number summary for
Q95: Find the mean for the list
Q96: Construct a boxplot.<br>-The weights (in pounds)
Q97: Construct a boxplot.<br>-The test scores of
Q98: Find the standard deviation. Round to
Q99: Find the mean<br>-The weight gains (in