Multiple Choice
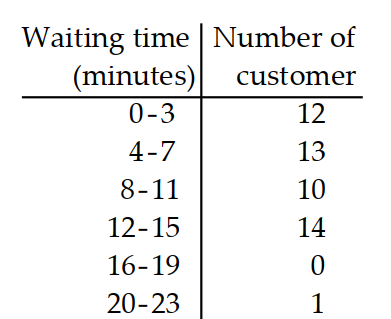
Find the standard deviation of the data summarized in the given frequency table.
-The manager of a bank recorded the amount of time each customer spent waiting in line during peak business hours one Monday. The frequency table below summarizes the results. Find the standard deviation. Round your answer to one decimal place.
A) 4.7
B) 5.4
C) 5.2
D) 5.0
Correct Answer:

Verified
Correct Answer:
Verified
Q103: Solve the problem. Round to the nearest
Q104: Find the median.<br>- <span class="ql-formula" data-value="35,40,34,36,33,35,39,38,31,34,36,37"><span
Q105: Find a <span class="ql-formula" data-value="z"><span
Q106: Prepare a frequency distribution for the given
Q107: A company installs 5000 light bulbs, each
Q109: Find the median.<br>- <span class="ql-formula" data-value="2,13,25,29,33,37"><span
Q110: Describe the shape of the given histogram.<br>-<img
Q111: Find the mode or modes.<br>- <span
Q112: Describe the shape of the given histogram.<br>-<img
Q113: Assume the distribution is normal. Use