Multiple Choice
Construct a boxplot.
-The weekly salaries (in dollars) of 24 randomly selected employees of a company are shown below. Construct a boxplot for the data set.
A) 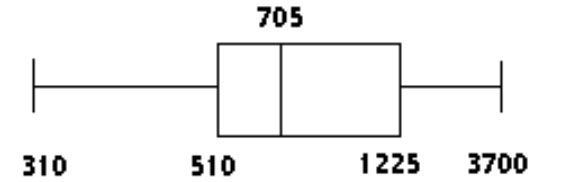
B) 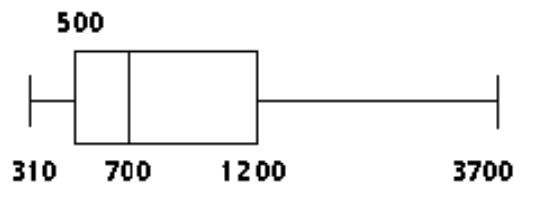
C) 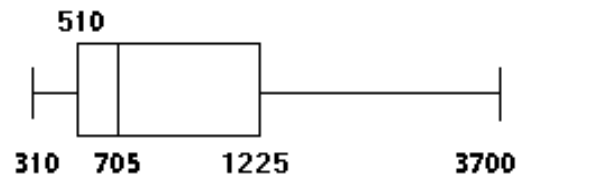
D) 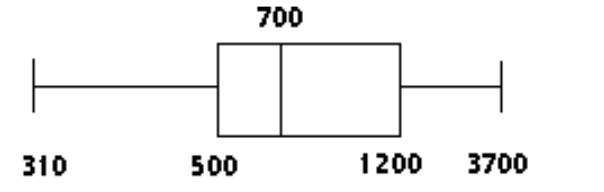
Correct Answer:

Verified
Correct Answer:
Verified
Q130: A company installs 5000 light bulbs, each
Q131: Obtain the five number summary for
Q132: Construct a-stem and leaf display for
Q133: Find the mean<br>-The Wellspring Company's fleet of
Q134: Find the median.<br>- <span class="ql-formula" data-value="19,26,38,46,61,67,86"><span
Q136: Find the mode or modes.<br>- <span
Q137: Construct a frequency polygon.<br>-<img src="https://d2lvgg3v3hfg70.cloudfront.net/TB10479/.jpg" alt="Construct a
Q138: Find the mean<br>-Frank's Furniture employees earned
Q139: Solve the problem.<br>-If the life, in
Q140: Find the range for the set