Multiple Choice
Construct a boxplot.
-The highest temperatures ever recorded (in ) in 32 different U.S. states are shown below. Construct a boxplot for the data set.
A) 
B) 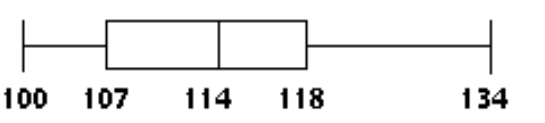
C) 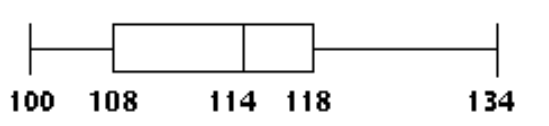
D) 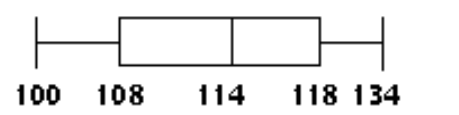
Correct Answer:

Verified
Correct Answer:
Verified
Related Questions
Q48: Prepare a frequency distribution for the
Q49: Find the standard deviation for the
Q50: Find the mean for the list
Q51: Find the mean<br>-Bill kept track of
Q52: Find the standard deviation for the
Q54: Obtain the five number summary for
Q55: Describe the shape of the given histogram.<br>-<img
Q56: Prepare a frequency distribution for the
Q57: Find the mean for the list
Q58: Solve the problem.<br>-The stem and leaf plot