Multiple Choice
The graph shows the total sales in thousand of dollars from the distribution of x thousand catalogs. Find the average rate of change of sales with respect to the number of catalogs distributed for the change in x.
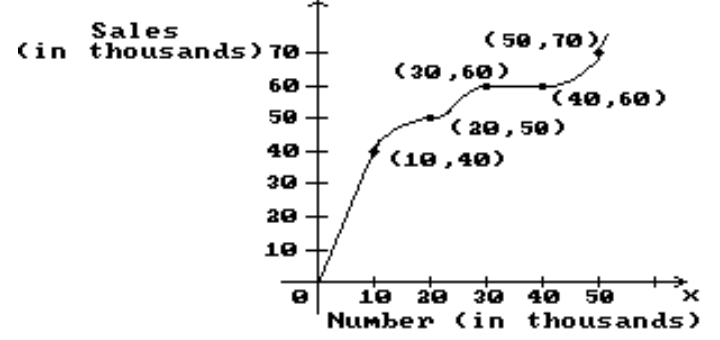
-10 to 20
A)
B) 1
C)
D) 2
Correct Answer:

Verified
Correct Answer:
Verified
Related Questions
Q19: Find the derivative of the function.<br>-
Q20: Find all points where the function
Q21: Find the derivative of the function.<br>-
Q22: Write the word or phrase that best
Q23: Find all points where the function
Q25: Solve the problem.<br>-The power <span
Q26: Find numbers <span class="ql-formula" data-value="a"><span
Q27: Find numbers <span class="ql-formula" data-value="a"><span
Q28: Use a calculator to estimate the
Q29: Find the derivative of the function.<br>-