Multiple Choice
The graph shows the total sales in thousand of dollars from the distribution of x thousand catalogs. Find the average rate of change of sales with respect to the number of catalogs distributed for the change in x.
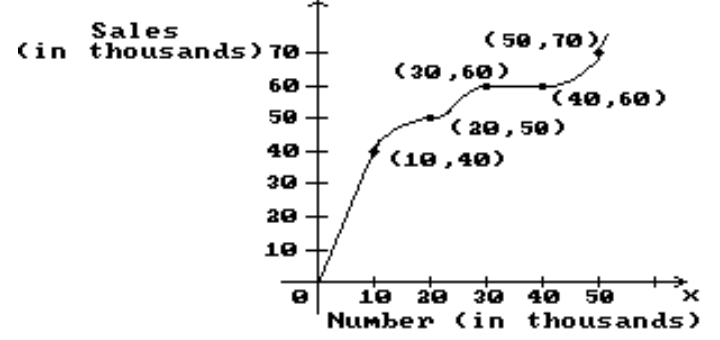
-20 to 50
A)
B)
C)
D)
Correct Answer:

Verified
Correct Answer:
Verified
Q279: Find <span class="ql-formula" data-value="f^{\prime}(x)"><span class="katex"><span
Q280: Decide whether or not the function
Q281: Find the following.<br>- <span class="ql-formula" data-value="f^{\prime}(-3)"><span
Q282: Solve the problem.<br>-Compute the instantaneous rate
Q283: Decide whether or not the function
Q285: Solve the problem.}<br>-The rate that a
Q286: Find <span class="ql-formula" data-value="f^{\prime}(x)"><span class="katex"><span
Q287: Let <span class="ql-formula" data-value="f(x)=8 x^{2}-5
Q288: Write interval notation for the graph.<br>-<img
Q289: Find the derivative.<br>- <span class="ql-formula" data-value="y=\frac{100}{2+9